You probably know that gerrymandering concerns drawing voting districts, as for state representatives, in such a way that one side gets an unfair advantage. How can you tell if it’s happening? Generally people like to point out the strange snakelike districts that are used to pack certain groups of voters together or break apart others. After all, it was a funny salamander-shaped congressional district that gave gerrymandering its name. So you might expect it to always result in spidery-lizardy districts. But look at these two maps of North Carolina.

This first one is an actual district map for North Carolina. It has some of those tell-tale salamander districts. By population, North Carolina is a red state, but not dramatically so. With 13 districts, you might expect a 7-6 split in favor of Republicans. But this map manages to squeeze out 10 red districts.
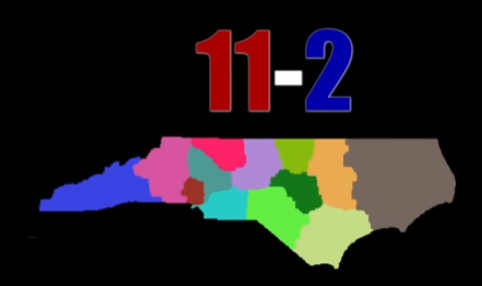
This second map was made by a physicist named Brian Haidet who took a great interest in gerrymandering. He wrote a program that can gerrymander successfully while avoiding the problem of snaky regions. This map “looks” fair, in the sense that the regions are reasonably shaped. And they all have roughly the same population. Yet he’s managed to give North Carolina Republicans 11 out of 13 representatives.
Here’s the video where he talks about the process: Algorithmic Redistricting: Elections made-to-order. It’s long, but it’s both entertaining and eye-opening. And it uses the prize-winning phrase “Markov Chain Monte Carlo Simulated Anneal.”
Here are my big takeaways from the video.
- Cheating does not mean funny district lines. If you’re good at math and maps, you can totally cheat with nice, sane-looking districts.
- Fairness is predicated on people’s voting preferences being stable and predictable. You must start with a baseline population and voting preference. This may be a safe assumption in these polarized times, but you still need to keep in mind that “fairness” is based on a distribution that needs to be resampled from time to time.
- If preferences are indeed stable and predictable, then the outcome is completely known. It is purely an exercise in geometry, foreordained well before the election by an algorithm. This seems weird, but there’s no escaping it.
- Even when you draw the districts so that they are fair, you still have a few degrees of freedom. Would you like the races to be close, or incumbent-favoring landslides?
Gerrymandering is a hot topic these days, partly because it lends itself to fun simulations that are now tractable on personal computers. So we now know what danger lurks in the redistricting process. There are plenty of good ways to limit cheating, but political interest means that whoever thinks they have the upper hand has no interest in trying to make the process fair.
In a sense, we’re lucky that the people trying to rig elections have been so ham-fisted about it. By making such obviously partisan maps, we are now at least alert to the danger. I think of this as the Photoshop Effect. Photos have been doctored since photography was first invented. But it took the widespread use of Photoshop for ordinary people to realize it. You never could trust photos, but now you KNOW you can’t trust photos. Voting districts have been doctored since Elbridge Gerry was the salamander-loving governor of Massachusetts. Thanks to the good work of people like Brian Haidet, more of us are starting to get wise to it.
